Online Sales Data Project Overview
Project Objectives
Cleaning the data.
Analysing sales performance and customer behaviour.
Visualizing trends and invistigating returned items.
About the dataset
The dataset comprises anonymized data on online sales transactions, capturing various aspects of product purchases, customer details, and order characteristics. This dataset can be utilized for analyzing sales trends, customer purchase behavior, and order management in e-commerce or retail.
Data Link HERE, Data usability is 8.82 and License is CCO:Public Domain.
columns discription
InvoiceNo: Number of the purchase in sequence.
StockCode: The code where the item is stored in the warehouse.
Description: Name of the item.
Quantity: Item amount per purchase.
InvoiceDate: Date of the purchase.
UnitPrice: price per unit within the purchase.
CustomerID: Register id for the customer.
Country: Country of the purchase.
Discount: Amount reduced per unit of the purchase.
PaymentMethod: How the payment was made.
ShippingCost: Fees to ship each order.
Category: Classification of product purchased.
SalesChannel: How the purchase was made, online or offline.
ReturnStatus: Whether the order was delivered successfully or returned.
ShipmentProvider: name of the company to ship the orders.
WarehouseLocation: Where the product was stored before shipping.
OrderPriority: Importance of the order, high, medium or low.
1- Libraries & tools Used
		Python
import pandas as pd
import numpy as np
import seaborn as sns
import matplotlib.pyplot as plt
import plotly.express as px

		MySQL Workbench

		Excel
2- data cleaning and preprocessing
Data usability was 8.2, no duplicates were found and no typing mistakes.
Cleaning steps involved filling nulls in 3 columns, reducing decimals, changing data types, trimming in one column, correcting negative values in 2 columns & reshaping a column entirely.
All cleaning process was performed repeatedly using Python, SQl and Excel.
2-1 Reducing Decimals
Discount column had more than 6 decimals within some values that i will reduce to 2.
		Python
df['Discount'] = df['Discount'].round(2)

		SQL
UPDATE online_sales_2
SET Discount = round(Discount, 2);
2-2 Changing Data Types
		Python
df['InvoiceDate'] = pd.to_datetime(df['InvoiceDate'])
df['CustomerID'] = df['CustomerID'].astype('str')
df['InvoiceNo'] = df['InvoiceNo'].astype('str')

		SQL
ALTER TABLE online_sales_2
MODIFY COLUMN InvoiceNo text,
MODIFY COLUMN CustomerID text,
MODIFY COLUMN InvoiceDate datetime;
2-3 Trimming Customer ID column
CustomerID column values had extra (.0) after the Id number, which needed to be removed
		Python
df["CustomerID"] = df["CustomerID"].str.rstrip('0').str.rstrip('.')

		SQL
UPDATE online_sales_2
SET CustomerID = REPLACE (CustomerID, '.0', '');
2-4 Turning negative Values into positive
Quantity & unitPrice columns had some negative values.
		Python
df['Quantity'] = df['Quantity'].abs()
df['UnitPrice'] = df["UnitPrice"].abs()

		SQL
UPDATE online_sales_2
	SET
	Quantity = abs(Quantity),
	UnitPrice = abs(UnitPrice);

		Excel
=IF(D2 < 0,(D2*-1),D2)
2-5 Reshaping Category Column
Category column values were totally messed, all items were calssified as all categories.
		Python
df['Category'] = df['Description'].apply(lambda x: 'Apparel' if x == 'T-shirt' else
		'Furniture' if x == 'Office Chair' else
		'Stationary' if x in ['Notebook', 'Blue Pen'] else
		'Accessories' if x in ['Backpack', 'Desk Lamp', 'Wall Clock', 'White Mug'] else
		'Electronics' if x in ['Wireless Mouse', 'USB Cable', 'Headphones'] else
		'unknown')

		SQL
UPDATE online_sales_2
	SET Category =
	CASE
		WHEN `Description` = 'T-shirt' THEN 'Apparel'
        WHEN `Description` = 'Office Chair' THEN 'Furniture'
        WHEN `Description` IN ('Notebook', 'Blue Pen') THEN 'Stationary'
        WHEN `Description` IN ('Wireless Mouse', 'USB Cable', 'Headphones') THEN 'Electronics'
        WHEN `Description` IN ('Backpack', 'Desk Lamp', 'Wall Clock', 'White Mug') THEN 'Accessories'
	END;

		Excel
(=IFS(C2="T-shirt","Apparel",C2="Office Chair","Furniture",C2="Notebook","Stationary",C2="Blue Pen","Stationary"
,C2="Backpack","Accessories",C2="Desk Lamp","Accessories",C2="Wall Clock","Accessories",C2="White Mug","Accessories"
,C2="Wireless Mouse","Electronics",C2="USB Cable","Electronics",C2="Headphones","Electronics"))
2-6 Filling Nulls
CustomerID, ShippingCost & WarehouseLocation columns had nulls.
For CustomerID column I will replace nulls with (unknown).
		Python
df['CustomerID'].replace('nan', 'unknown', inplace = True)

		SQL
UPDATE online_sales_2
	SET CustomerID = 'Unknown'
	WHERE CustomerID = '';

		Excel
=IF(G2="","Unknown", G2)
For ShippingCost & WarehouseLocation nulls,i will Use forward fill Method.
		Python
df['ShippingCost'].fillna(method = 'ffill', inplace = True)
df['WarehouseLocation'].fillna(method="ffill" , inplace = True)

		SQL
	-- 1- creating a new column row_num to use as an index
ALTER TABLE online_sales_2 ADD COLUMN row_num INT;
SET @row_number = 0;
UPDATE online_sales_2 SET row_num = (@row_number := @row_number + 1) ORDER BY invoicedate;

	-- 2- Creating a common table expression to group null cell with the nearest non null cell above
WITH cte1 AS
(
SELECT ShippingCost, row_num, COUNT(ShippingCost) OVER (ORDER BY row_num) AS nulls_grouped
FROM online_sales_2
),  -- 3- Creating another CTE to make a column with ShippingCost nulls filled
cte2 AS
(
SELECT row_num, ShippingCost, nulls_grouped,
FIRST_VALUE(ShippingCost) OVER (PARTITION BY nulls_grouped ORDER BY row_num) AS new_shippingcost
FROM cte1
)  -- 4- Using a join to update online_sales_2 from the new filled column created as a cte (cte2)
UPDATE online_sales_2
JOIN cte2
ON online_sales_2.row_num = cte2.row_num
SET online_sales_2.ShippingCost = cte2.new_shippingcost
WHERE online_sales_2.ShippingCost IS NULL;  -- Notice that the three steps are in one query without ;
-- 5- Same procedure for WarehouseLocation nulls

		Excel
Select the column with nulls - Click home from ribbon - Click Find & Select from Editing section -
go to special - tik on blanks - all null cells will be selected - type = and arrow up - then Ctrl+Enter.
before moving to the next step I needed to figure out whether the Discount valus is per unit or per order, and whether ShippingCost is paid by Client or the company.
I followed four steps
-1 How proportionate is the discount to unit price and order price?
-2 If there is an invoice repeated, does it has the same discount applied?
-3 Will there be negative values if the product povider pays for shipping?
-4 Business Logic.
Discount value was more proportionate with UnitPrice, same invoice had different discount values, over 500 negative values if company pays the shipping and business logic is discount is per unit while client pays for shipping.
Decision is Discount is per unit and client pays ShippingCost.
3- Feature Engineering
Feature Engineering is the process of creating new features or transforming existing features to improve the performance the data.
3-1 Python
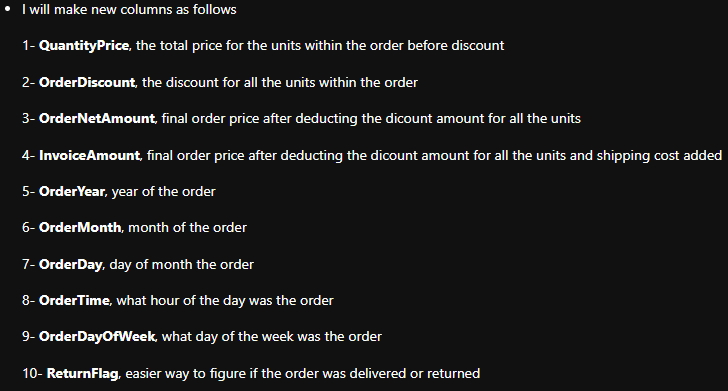
df['QuantityPrice'] = (df.Quantity * df.UnitPrice).round(2)
df['OrderDiscount'] = (df.Quantity * df.Discount).round(2)
df['OrderNetAmount'] = (df.QuantityPrice - df.OrderDiscount).round(2)
df['InvoiceAmount'] = (df.OrderNetAmount + df.ShippingCost).round(2)
df['OrderYear'] = df.InvoiceDate.dt.year.astype(str)
df['OrderMonthName'] = df.InvoiceDate.dt.month_name()
df['OrderMonth'] = df.InvoiceDate.dt.month
df['OrderDay'] = df.InvoiceDate.dt.day.astype(str)
df['OrderTime'] = df.InvoiceDate.dt.time
df['OrderDayOfWeek'] = df.InvoiceDate.dt.day_name()
3-2 SQL
Here I created new columns contaning numbers parallel to a distinct value of another column to minimize memory usage.
Then i will create new tables of distinct values like countries that i can use later using joins.
Lastly deleting those columns while keeping the indexes columns will minimize data usage.
Example
	-- Creating the columns
ALTER TABLE online_sales_2
ADD COLUMN (
DescriptionIndex text,
CountryIndex text,
PaymentMethodIndex text,
CategoryIndex text,
SalesChannelIndex text,
ReturnStatusIndex text,
ShipmentProviderIndex text,
WarehouseLocationIndex text,
OrderPriorityIndex text
);
	-- Filling a column
UPDATE online_sales_2
SET SalesChannelIndex =
CASE
WHEN SalesChannel = 'In-store' THEN '1'
WHEN SalesChannel = 'Online' THEN '2'
END;
	-- Creating new table and accommodating data
CREATE TABLE sales_channel (
SalesChannelIndex TEXT,
SalesChannel TEXT)
	AS
SELECT DISTINCT SalesChannelIndex, SalesChannel FROM online_sales_2;
	-- Deleting columns
ALTER TABLE online_sales_2
DROP COLUMN SalesChannel;
Same procedure was performed to all columns created.
4- Data Visualization & EDA
4-1 Product Performance
4-1-1 Revenue generated by item
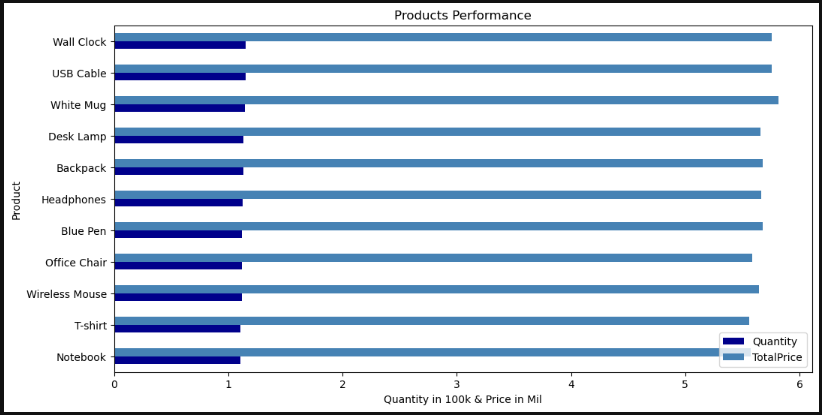
Visualizing the revenue generated for each item helps with understanding which product performed well and what product needs solutions for inhanced sales
4-1-2 Quantity Sold By Product
Visualizing revenue generated for items is not enough to draw a conclusion about products performance, quantity sold helps with making the pic more clear.
Product quantity sold included within the same chart above.
4-1-3 Products Price Range
All of the items sold nearly the same quantity and generated very close revenue, despite the differences in usage, sizes,materials and most importantly the production cost 'not available in the data'. that requires a further look in products price range and averages.
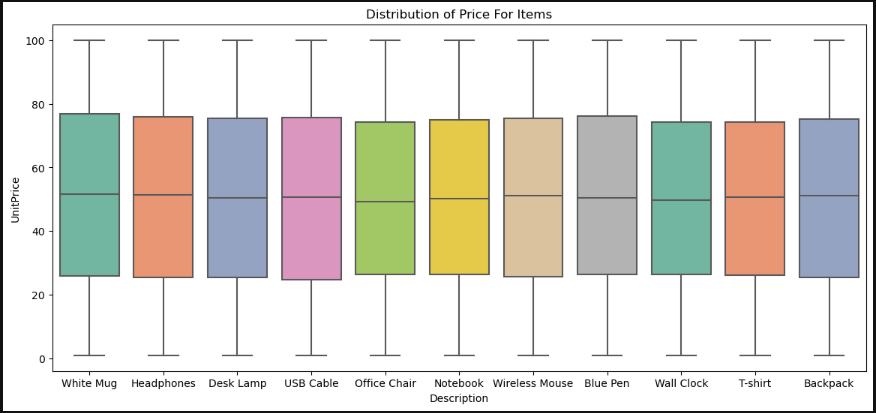
Equal price distribution for all items which is the reason behind equal revenue generated alongside the same performance of quantities sold.
4-2 Sales trends
Visualizing complex data trends makes it easier to stakeholders to understand and make strategic decisions as it
1- Identifies upwards and downwards over time.
2- Reveals seasons patterns and cycle behaviour.
3- Allows comparison against past performance.
4- Helps in spotting anomalies or outliers.
5- Helps with predicting future trends and planning for it.
4-2-1 Monthly Trends and yearly Growth

No monthly trends and no growth over years.
4-2-2 Day Of The Week Trends
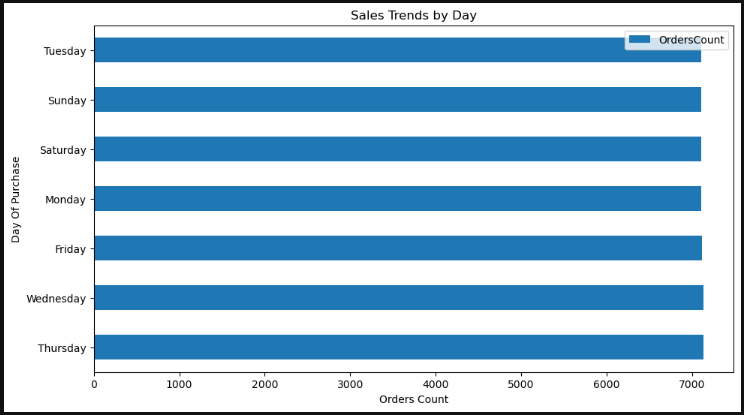
No trends can be seen.
4-2-3 Purchase Time Trends
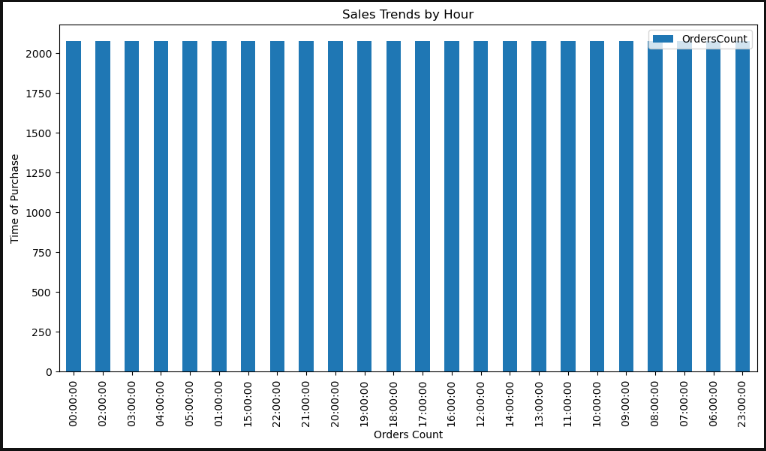
No trends to be seen
4-3 Customer Analysis
Customer analysis has a crucial role in business success due to many reasons like,
1- Indentify customers segements and their needs toward more precise marketing efforts.
2- Understanding trends and customer behaviour toward better future planning.
3- Helps in strategic pricing decisions based on customer behaviour.
4- It guides toward product improvement or new product development.
4-3-1 Customer Distribution & Sales Channel preference
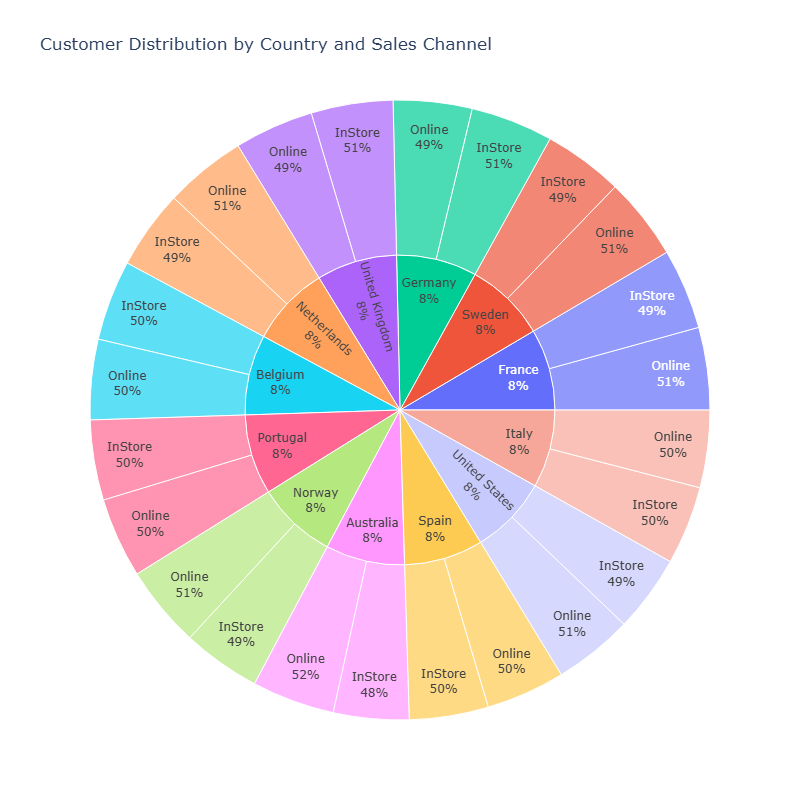
4-4 Returned Items Analysis
Despite being within the normal range of returned ites, analyzing it provides insights that can help to improved product quality, customer satisfaction, cost savings, and strategic business adjustments
4-4-1 Distribution Of Returned items
Here the aim is to identify if an item was returned with a higher rate, which may lead to a potential production issues.
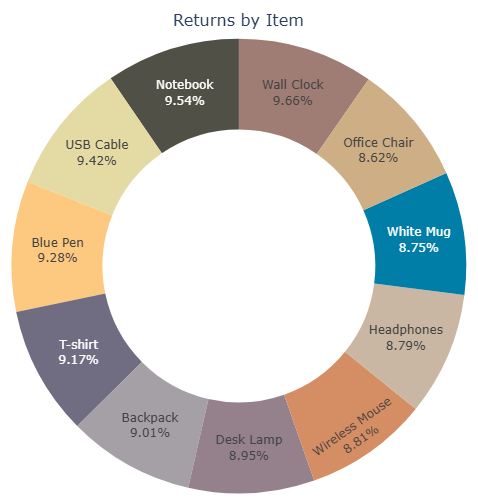
No product was returned at a noticeable higher rate than other products, that means no production flaws that made a certain product defective.
4-4-2 Warehouse Returns
A warehouse may ship a damaged product
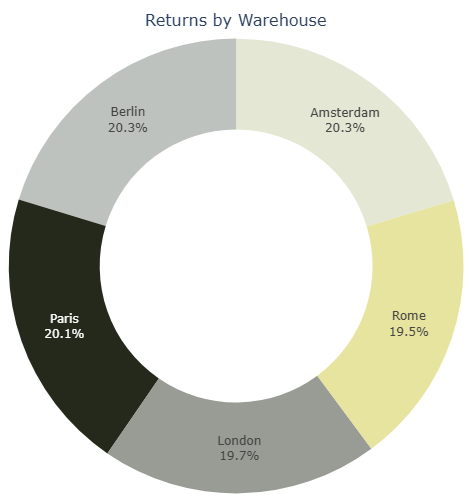
No certain warehouse damaged items with an increased rate before shipping as returned items are evenly distributed between warehouses.
4-4-3 Shipment Provider Returns
Damages, delays or even underperforming
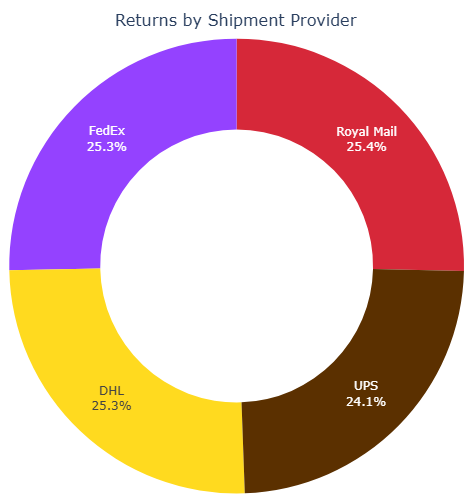
Returned items are distributed even between shipping providers, hence no signs of a certain shipping provider delivering products with damages nor the behaviour of shipping employees is inappropriate.
5 Findings
5-1 Product Performance
All products performed the same when it comes to quantity sold and revenue generated despite being different in sizes, usage and production cost, reason is the same average price for all products.
5-2 Sales trends
Visualizing the count of purchases against day hours, days, weeks, month and quarter did not show any signs of purchasing trends, all purchasing patterns are stable.
5-3 Customer Analysis
Customers are evenly distributed between the 12 countries within the data.
No customer preference for payment method nor sales channel.
5-4 Returns Analysis
No certain warehouse damaged items with an increased rate before shipping as returned items are evenly distributed between warehouses.
No product was returned at a noticeable higher rate than other products, that means no production flaws that made a certain product defective.
Returned items are distributed even between shipping providers, hence no signs of a certain shipping provider delivering products with damages nor the behaviour of shipping employees is inappropriate.
6 Implications
6-1 Product Performance
The uniform performance despite the differences between products implies that pricing strategy is the key and it suggests that the average price being the same might be a key driving equal performance across diverse products.
Pricing strategy should be investigated to decide whether same pricing is more effective toward the best performance or the differentiated pricing based on product characteristics.
6-2 Sales trends
Stable purchasing patterns across time frames suggests a stable customers behaviour which indicates a mature market where consumer habits are not affected with external factors.
6-3 Customer Analysis
Even distribution across the 12 countries suggests the wide geographical reach, it may implies a strong global distributing brand.
The equal preference between sales channels and payment method implies the success of making different options of payments and sales channels of an equal value, liability and accessibility.
6-4 Returns Analysis
The even distribution of the returned items implies a high level in production quality, robust quality control and handling at warehouses and a reliable shipping providers with consistency in shipping services with no underperforming.
!!! The overall result that distribution is stable in all aspects might suggest that data is generated in a controlled environment or represents a distributer with high standards in operations and a robust efficiency beside a stable long term contracts.