US Real Estate Sales Cleaning Project

Project Objectives
Cleaning the dataset from the numerous outliers using Python.
About the dataset
The Office of Policy and Management maintains a listing of all real estate sales with a sales price of $2,000 or greater that occur between October 1 and September 30 of each year. For each sale record, the file includes town, property address, date of sale, property type (residential, apartment, commercial, industrial, or vacant land), sales price, and property assessment. Data Link HERE, Data usability is 8.82 and License is U.S. Government Works, data dimensions (997213, 15).
columns discription
Serial Number: Regestration number of the transaction.
List Year: The year when the transation was listed in the system.
Date Recorded: Date of the transaction including Day, Month and Year
Town: Town of the property in the recorded transaction.
Adress: Street name and property number.
Assessed Value: The value of the property as determined by public tax assessor for the purpose of taxation.
Sale Amount: Actual amount paid for the sold property.
Sales Ratio: Relationship between assessed value and sale amount.
Property Type: Commertial, Residentai, land etc.
Residential Type: family or condominium.
OPM remarks: Remarks of US Office of Personnel Management
mind talk
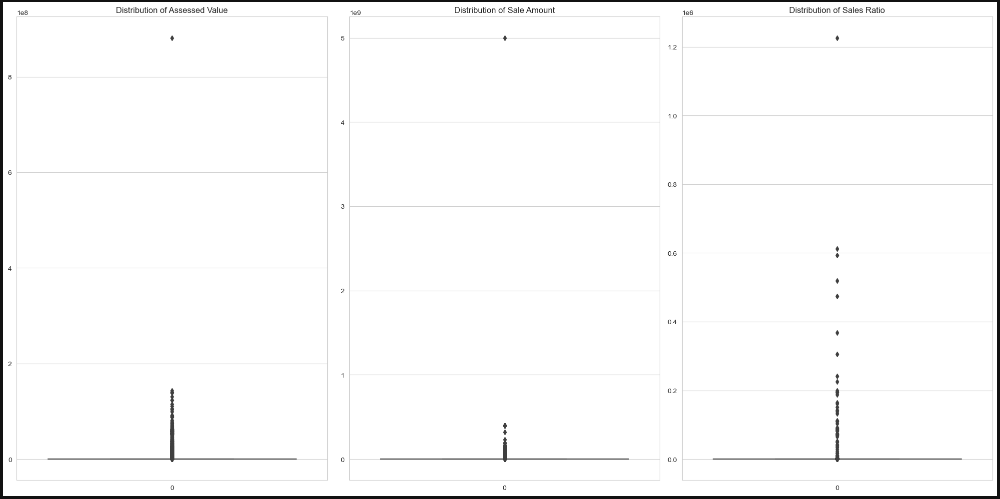
While cleaning the dataset, i noticed some properties were assessed or sold for very low amounts down to zero, which made the corresponding sales ratio gets down to zero or becomes very high. This caused the mean for sales ratio column to be above 10, which is an unrealestic value. to solve that issue we can simply look for outliers to remove them, which is an easy and a simple solution, but i decided to go further by trying to cure some of these values before removing the outliers that will remain.
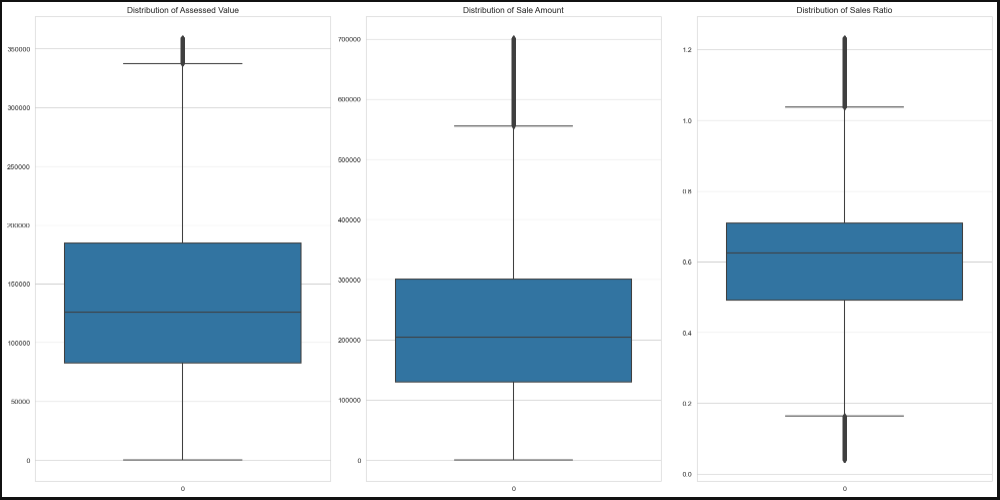
Dataset dimensions when I removed all outliers is (785168, 15).
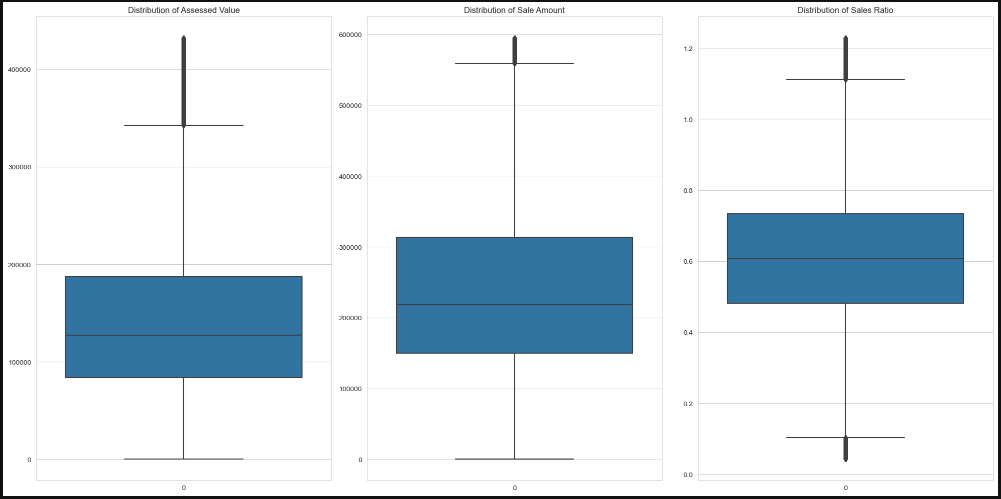
Dataset dimensions when I did some curing first before outliers removal is (871798, 15)
libraries used
import pandas as pd
import numpy as np
import matplotlib.pyplot as plt
import seaborn as sns
data cleaning process
As mentioned earlier the data had numerous outliers 'nearly 20%', so the cleaning process will be about handling the outliers via two methods by removing them and by curing some outliers before deleting the ones that I could not fix and will do an overview of the handling process.
method 1: handling outliers
1-1 removing the rows that have both Assessed value and Sale amount at zero.
# making a new column by summing both columns assessed and sale values
df['temp']=df['Assessed Value']+df['Sale Amount']
df = df[df.temp > 0] # Removing the rows with values 0
del df['temp'] # deleting the temporary column
1-2 Replacing the outliers of Sales ratio with its median value.
This step will change the unrealistic values of the sales ratio to a more reasonable value and it will help with changing some values of assessed and sale amount.
# Defining the variables needed to find and change outliers .
Q1_SR = df['Sales Ratio'].quantile(0.25) # first quartile
Q2_SR = df['Sales Ratio'].quantile(0.50) # second quartile 'median'
Q3_SR = df['Sales Ratio'].quantile(0.75) # third quartile
IQR_SR = Q3_SR - Q1_SR                   # interquartile range
upper_SR = Q3_SR + (1.5 * IQR_SR)        # upper limit of the data 'max'
lower_SR = Q1_SR - (1.5 * IQR_SR)        # lower limit of data 'min'

# Changing values higher than max with more reasonable value 'median'.
df["Sales Ratio"] = np.where(df["Sales Ratio"] > upper_SR,Q2_SR,df["Sales Ratio"])

# Changing values below min with median.
df['Sales Ratio'] = np.where(df['Sales Ratio'] < lower_SR, Q2_SR, df['Sales Ratio'])
1-3 Replacing some Assessed and sale values.
Here I created two temporary columns for assessed value and sale amount using the newly fixed sales ratio column, this will result in a better and realistic values for both columns where the sales ratio was very high or very low, then replacing the Sale and Assessed values that are less than 10k with the corresponding value from the temporary columns, that will fix some values as it is not logical to sell a property with such low price.
# Creating two temporary columns of Sale amount and Assessed value.
# In here, sales ratio values were cleaned so using it will clean some outliers.
df['Sale_Amount_Temp']=df['Assessed Value']/df['Sales Ratio']
df['Assessed_Value_Temp']=df['Sale Amount']*df['Sales Ratio']


df.loc[df['Sale Amount'] <= 10000 , 'Sale Amount'] = df.loc[df['Sale Amount'] <= 10000 , 'Sale_Amount_Temp']
df.loc[df['Assessed Value'] <= 10000 , 'Assessed Value'] = df.loc[df['Assessed Value'] <= 10000 , 'Assessed_Value_Temp']
1-4 Removing the rows That still has 0 values.
df = df[df.Sale_Amount_Temp > 0]
df = df[df.Assessed_Value_Temp > 0]
df.shape
(988757, 17)
1-5 replacing high values.
Replacing the values higher than max with its corresponding values from the temporary columns
df.loc[df['Sale Amount'] > upper_SA , 'Sale Amount'] = df.loc[df['Sale Amount'] > upper_SA , 'Sale_Amount_Temp']
df.loc[df['Assessed Value'] > upper_AV , 'Assessed Value'] = df.loc[df['Assessed Value'] > upper_AV , 'Assessed_Value_Temp']
1-6 removing the outliers remaining.
df=df[(df['Sale Amount'] > (Q1_SA - 1.5 * IQR_SA)) & (df['Sale Amount'] < (Q3_SA + 1.5 * IQR_SA))]
df=df[(df['Assessed Value'] > (Q1_AV - 1.5 * IQR_AV)) & (df['Assessed Value'] < (Q3_AV + 1.5 * IQR_AV))]
df.shape
(871798, 17)
Here is the result after removing the two temporary columns (871798, 15)
method 2: removing outliers
2-1 Defining function to remove outliers
First I imported the data again as df2 as the previously imported data frame df is fixed
def remove_outliers_iqr(df2, column):
	Q1 = df2[column].quantile(0.25)
	Q3 = df2[column].quantile(0.75)
	IQR = Q3 - Q1
	lower_bound = Q1 - 1.5 * IQR
	upper_bound = Q3 + 1.5 * IQR
	return df2[(df2[column] >= lower_bound) & (df2[column] <= upper_bound)]
2-2 making a loop through outliers
# Loop through each column and remove outliers
for column in df2[['Assessed Value', 'Sale Amount', 'Sales Ratio']]:
df2 = remove_outliers_iqr(df2, column)

# Display the DataFrame without outliers
print(df2.shape)
(785168, 15)
exploratory data analysis EDA
Performing EDA helps with understanding trends , patterns. We use for that step visualization tools like Matplotlip and Seaborn.
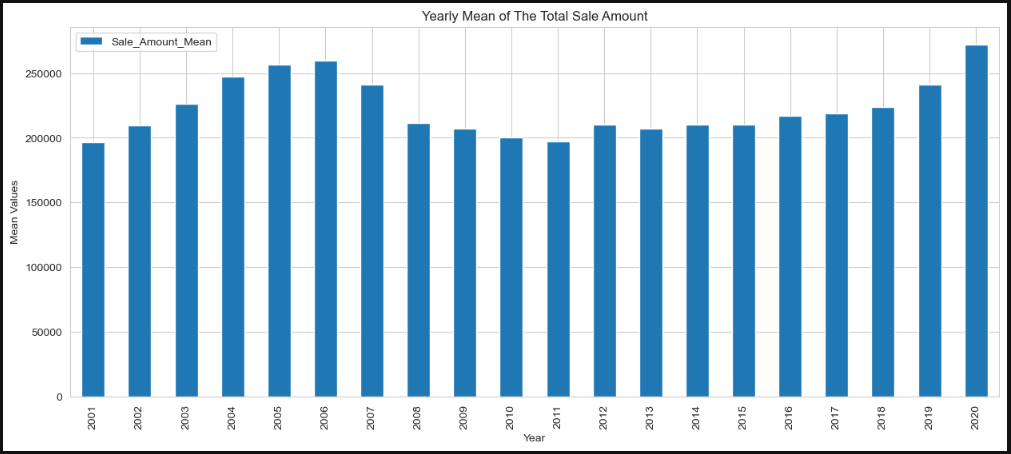
The visuals i made from the data frame were total properities sold per year against the yearly total sale amount within a grouped column chart, and another column chart for the yearly mean sale amount.
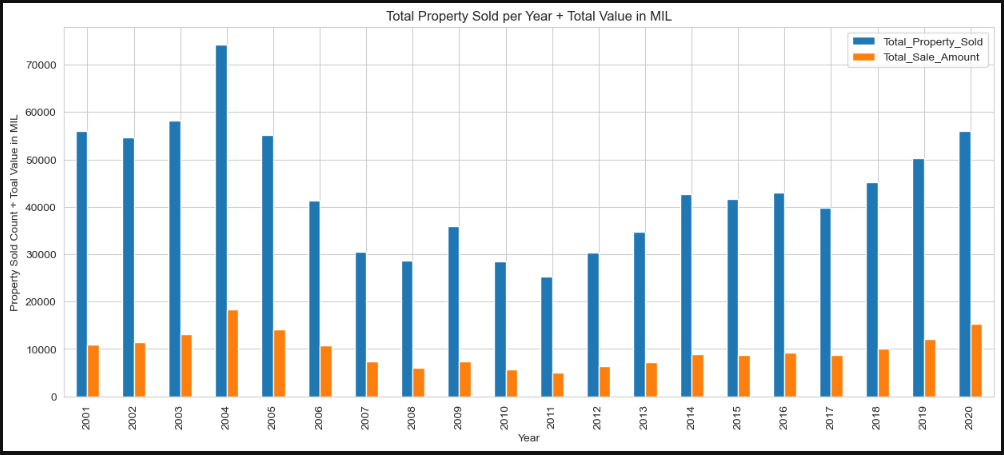
As seen there was signs of the 2008 economic crisses as the total properities sold started to drop in 2005
