Housing Price Prediction Project Objectives & Overview

Project Objectives
Developing a predictive price model for houses as it is very important for real estate sector to estimate prices of the properities & to use a wide varity of analytical tools and techniques.
About the dataset
This dataset provides key features for predicting house prices, including area, bedrooms, bathrooms, stories, amenities like air conditioning and parking, and information on furnishing status. It enables analysis and modelling to understand the factors impacting house prices and develop accurate predictions in real estate markets, Data Link HERE, Data usability is 10 and License is CCO:Public Domain.
columns discription
Price: The price of the house.
Area: The total area of the house in square feet.
Bedrooms: The number of bedrooms in the house.
Bathrooms: The number of bathrooms in the house.
Stories: The number of stories in the house.
Mainroad: Whether the house is connected to the main road (Yes/No).
Guestroom: Whether the house has a guest room (Yes/No).
Basement: Whether the house has a basement (Yes/No).
Hot water heating: Whether the house has a hot water heating system (Yes/No).
Airconditioning: Whether the house has an air conditioning system (Yes/No).
Parking: The number of parking spaces available within the house.
Prefarea: Whether the house is located in a preferred area (Yes/No).
Furnishing status: The furnishing status of the house (Fully Furnished, Semi-Furnished, Unfurnished).
libraries & models used
Importing manipulation, visualization and preprocessing libraries beside all models and metrics used.
import pandas as pd
import numpy as np
import seaborn as sns
import matplotlib.pyplot as plt

from sklearn.model_selection import train_test_split
from sklearn.linear_model import LinearRegression
from sklearn.metrics import mean_squared_error, mean_absolute_error, r2_score
from sklearn.preprocessing import MinMaxScaler, StandardScaler
from sklearn.preprocessing import PolynomialFeatures
from sklearn.pipeline import Pipeline
from scipy import stats
data cleaning and preprocessing
As the data usability is 10, there were no null and no duplicates. Outliers were present and had different impacts upon the models results when experimenting. Data had 545 row, while after removing outliers from (price, area, parking, bathrooms) columns it became 501 row.

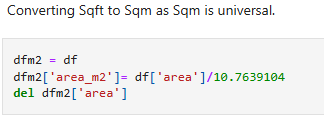
Data formating was performed to convert area column from SqFt to SqM, converting categorical variables to numerical variables using OneHotEncoding method followed by data normalization using Min Max Scaler and Standard Scaler for training and testing.

exploratory data analysis EDA
Performing EDA helps with understanding trends , patterns and correlations between different variables to identify which features are most important for our prediction model. We use for that step visualization tools like Matplotlip and Seaborn.
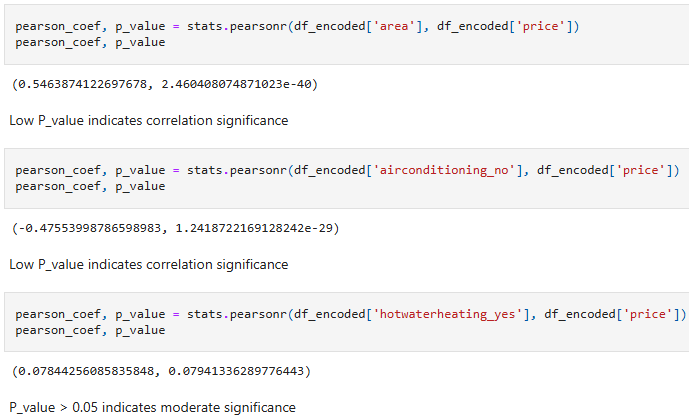
For that step I used the heatmap visual to view how each of the predictor variables correlate to the target variable 'price' and then tested the statistical significance of the correlations using the P-Value.
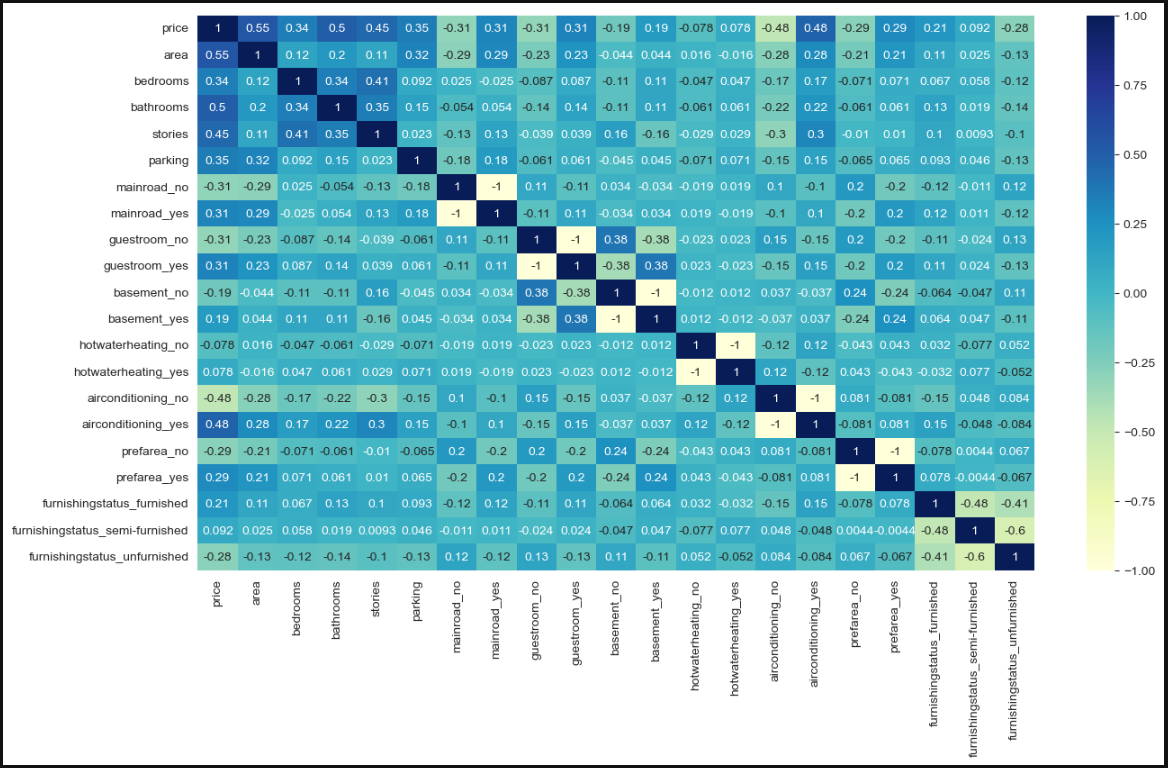
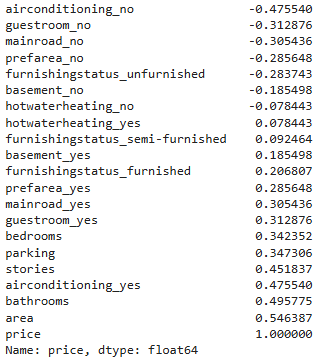
 strong negative correlation <-0.7
-0.7 < moderate negative correlation <-0.3
-0.3 < weak negative correlation <0.0
 0.0 < weak positive correlation <0.3
 0.3 < moderate positive correlation <0.7
 0.7 < strong positive correlation
P-Value is the probability value that the correlation between two variables to be statistically significant.
the p-value is < 0.001: strong evidence that the correlation is significant
the p-value is <  0.05: moderate evidence that the correlation is significant
the p-value is <  0.1:  weak evidence that the correlation is significant
the p-value is >  0.1:  no evidence that the correlation is significant
feature engineering
Feature Engineering is the process of creating new features or transforming existing features to improve the performance of a machine-learning model.
Four feature engineered columns were created and tested for correlation with price (Total rooms per house - Number of rooms per story - Number of bathrooms per story - Story area), only the total rooms per house had a moderate correlation with price, while the rest of the columns had a very weak correlation so I deleted them after.


model selection, training & evaluation
A varity of Multiple linear regressions (MLR) and Polynomial regression models were trained using different compinations of columns with normalized data via both MinMaxScaler and StandardScaler, also the models were trained using SqFt & SqM for area column.
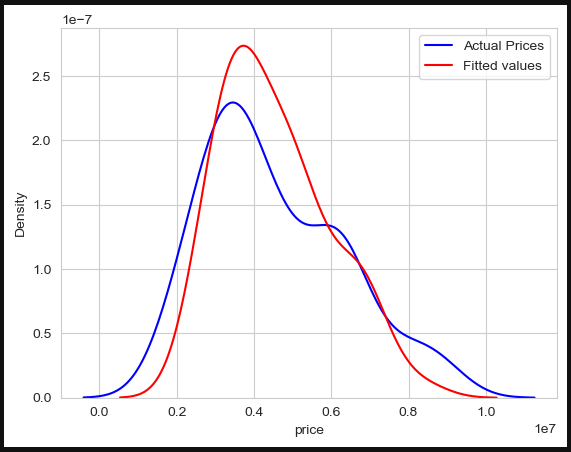
Model evaluation was performed using the Mean Absolute Error (MAE) and the R_squared. A value of MAE that is less than 10% will be a good result while an r2_score is good for a result of 0.8 or higher. The best result was obtained using the MLR for all the predictor variables with the data normalized by the MinMaxScaler (r2_score = 0.7570241008595766, MAE = 652812.594059406).
Model evaluation via visuals was performed using the Kernal Desity Plot (kdeplot) to see how the actual and fitted values are close to each other.
documenting results
| Model | R2 | MAE |
|---|---|---|
| Multiple Linear Regression for all predictors & MinMaxScaler | 0.7570241008595766 | 652812.594059406 |
| Multiple Linear Regression for all predictors not normalized using M2 area | 0.7477138179826605 | 665355.0147424549 |
| Multiple Linear Regression for all predictors not normalized using SqFt area | 0.747659622660183 | 665602.0180010083 |
| Multiple Linear Regression for all predictors & StandardScaler | 0.7476596226601808 | 665602.0180010106 |
| Multiple Linear Regression for all predictors & feature engineered column | 0.7476596226601806 | 665602.0180010108 |
| Multiple Linear Regression for 18 predictor | 0.7434242379347594 | 682336.0792079208 |
| Polynomial Regression | 0.7189785571297055 | 677800.6336633663 |
| Multiple Linear Regression for Non categorical predictors | 0.6325775885965157 | 845848.1072437116 |
Decision making
Comparing the results of MAE and R2 of the models trained and tested, we conclude that the MLR model using all normalized predictors is the best model to be able to predict prices from the dataset, nearly 75% of the prices.
MAE = 652812.594059406, r2_score = 0.7570241008595766
More advanced machine learning models could be used, like Random Forest, Decision Trees, Lasso Regression, Gradiant Boosting and Neural Networks but I am not familiar with hyperparameter tuning and machine learning methods.