Olympics Historical Data EDA
Project Objectives
Performing exploratory data analysis to visualize and understand trends and patterns and to present the gross over time.
About the dataset
The Olympic Games are an international multi-sport event held every four years in which thousands of athletes from around the world participate in various sports competitions. The Olympics are one of the most significant and prestigious sporting events globally, promoting unity, friendship, and fair play among nations, Data Link HERE, Data usability is 10 and License is ODC:Public Domain Dedication, data dimensions (70000, 17).
columns discription
ID: Unique identifier for each athlete
Name: Name of the athlete
Sex: Gender of the athlete (M for male, F for female)
Age: Age of the athlete
Height: Height of the athlete in cm
Weight: Weight of the athlete in kg
Team: The team the athlete is representing
NOC: National Olympic Committee 3-letter code
Games: The specific Games the athlete participated in
Year: The year of the Games
Season: The season of the Games (Summer or Winter)
City: The city where the Games were held
Sport: The sport in which the athlete participated
Event: The specific event within the sport
Medal: The medal won by the athlete (if any)
Libraries used
import pandas as pd
import numpy as np
import seaborn as sns
import matplotlib as mpl
import matplotlib.pyplot as plt
data cleaning and preprocessing
At first I merged the dataframe as it had countries names as 3 letter code, which can be tricky for some individuals, with another that had the 3 letter code with its corresponding country name.
Duplicates Removal
The 70000 row dataframe had 383 duplicate row that were removed.
Handling Nulls
The data had nulls within 6 of the 17 columns that i chose to ignore in some columns (notes), deleted for country column, replaced with 0 for medal column and replaced with mean for age, hight and weight as seen below.
merged[['Age','Height','Weight','Medal','Country','notes']].isnull().sum()
Age         2671
Height     15876
Weight     16718
Medal      59931
Country       63
notes      68374

# Handling nulls
merged['Medal'].fillna(0, inplace=True)
merged['Age'].fillna(merged['Age'].mean , inplace=True)
merged['Height'].fillna(merged['Height'].mean , inplace=True)
merged['Weight'].fillna(merged['Weight'].mean , inplace=True)
merged.dropna(subset=["Country"], inplace=True)
exploratory data analysis EDA
As mentiond above that I will perform exploratory data analysis to visualize and understand trends and patterns and to present the gross over time, so let's dive through the visuals made.
1- Gross of sports count over time
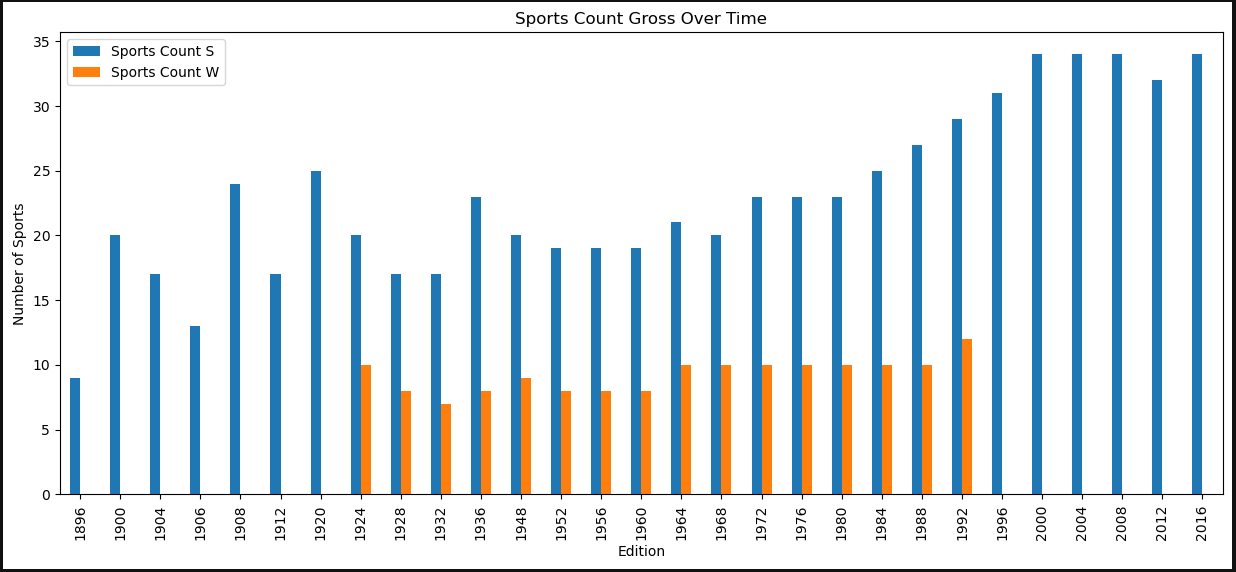
As we can see sports count developed thoughout the time for summer sports in blue despite having drops several times, while the count is nearly stable for winter sports as ice sports are not divrese.
2- Gross of athlete count over time
It is expected that the gross of sports count would inflict on the total numper of athletes participating, which can be seen below as true.
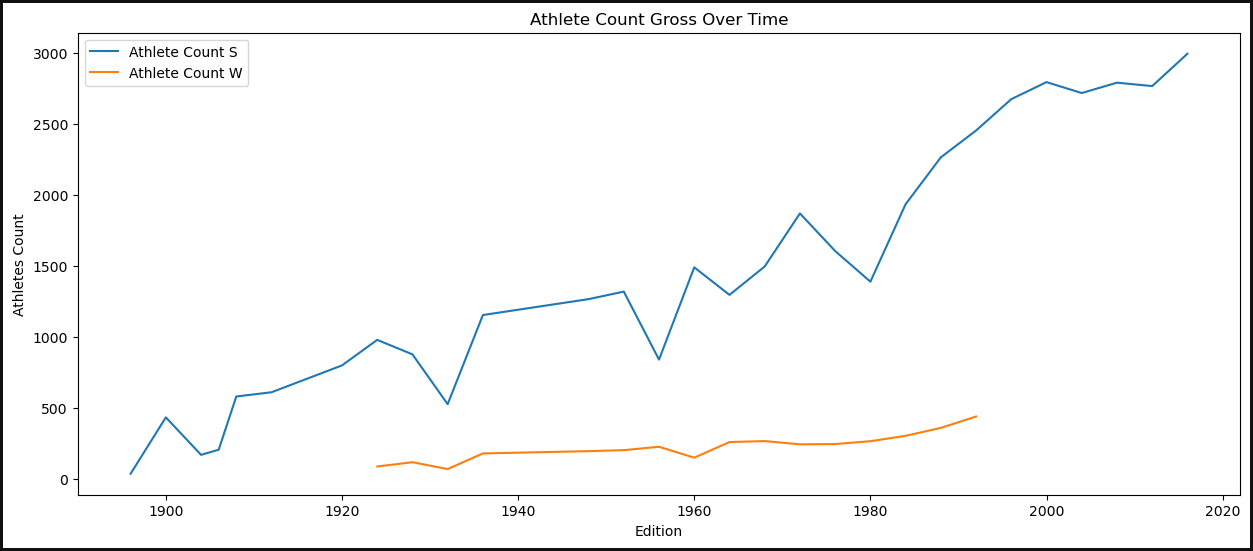
As expected Number of athletes participating in every season increased over time, but the count dropped significantly few times which is a matter that needs invistigation.Atheletes count taking part in winter games is nearly stable again.
3- Gender Participation
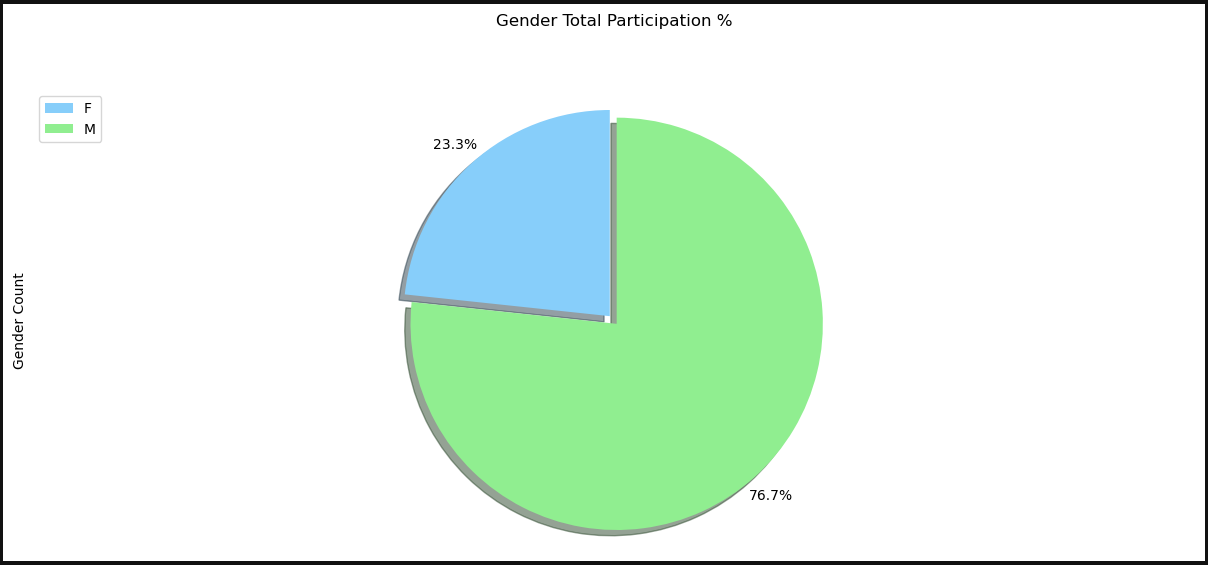
Male participation 76.7% is far higher than female participation 23.3%, but has male participation always been very high than female participation over every season? that can be tricky, so lets visualize the gender participation for every season next.
4- Gender Participation Per Season
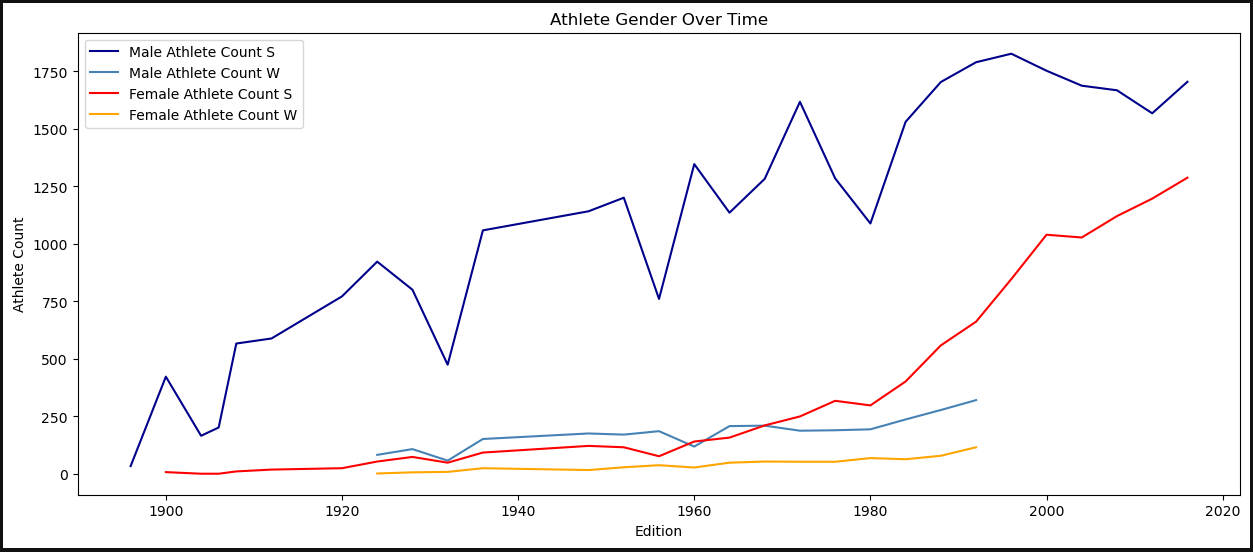
Here the pic is more clear. Gender participation gap started decreasing with 1984 season and still closing, and the low female participation before that date is what made the gender participation gap very wide.
Again we can notice that there was significat drop in participation within different seasons.
5- Top Successful Countries
HISTORICAL OLYMPIC DATA FINDINGS
- sample size is 70000 row for Olympics from 1896 to 2016.

- Number of sports and events developed throughout history.
- Stable count for winter sports as the sports involving ice are not diverse.
- Winter games do not share same popularity as summer games.
- Number of summer sports increased from 9 to reach 34.
- the increase in sports count has a positive impact on Country count and more on athletes count.

- there were 4 olympics where athlete and country participation dropped significantly.
- 1904 due to tensions caused by the Russo–Japanese War and difficulties in traveling to St. Louis.
- 1932 due to the great depression of 1929.
- 1956 due to boycott started by Egypt, Iraq, Campodia and Lebanon in response to the Seuz canal crisis.
- 1980 as the US started boycott protesting against the Soviet Union invading Afghanistan.

- Gender participation has male domination by 76.7% over 23.3% for female athletes.
- Male and female participation in Winter olympics is close and stable over time.
- Male and female participation in summer olympics increased over time and the gap is decreasing from 1984 and onward.
- For future, itroducing new sports and events for both male and female shall decrease the gap.

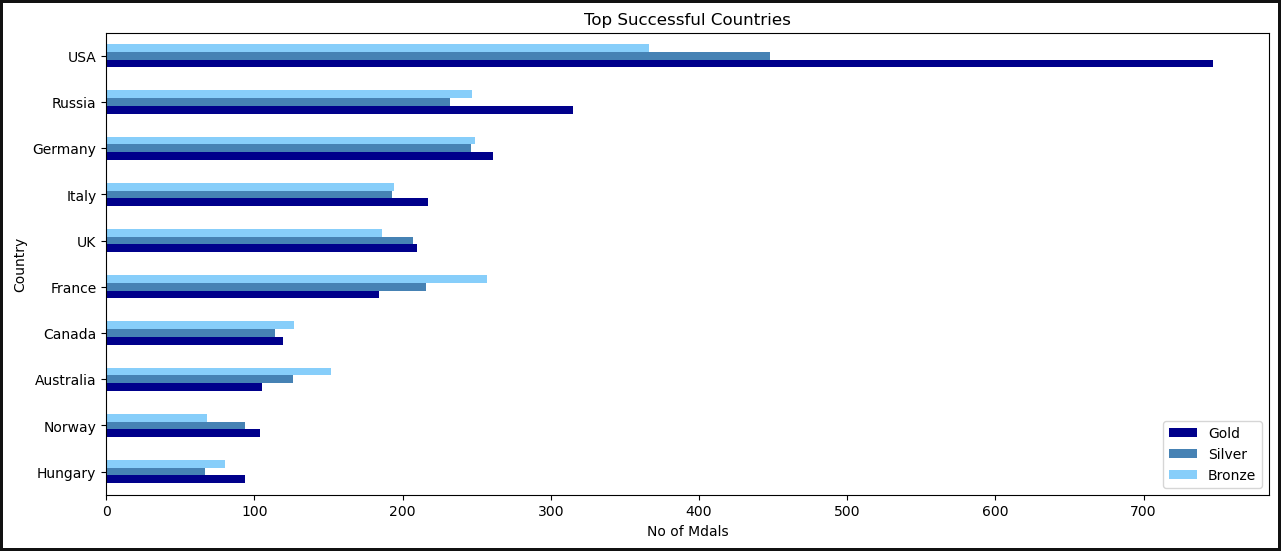
- USA is the most successful country followed by Rusiia, Germany and other countries.